We are transitioning from ve.com to prochart.com over the next 30 days. Please update your links and contact info.
Same Visual Engineering, same great products, just a new domain name. You can also reach us at visualprochart.com

ProChart Pattern Recognition
Chart Patterns – I know it when I see it!

Request a Demo

Chart patterns are an important component in a trader’s arsenal of technical analysis tools. Patterns themselves reflect behavioral patterns or more specifically, patterned trading behavior that has been studied and used in one form or another since the 1930’s, perhaps earlier.

Pattern recognition is fairly subjective and while there is clearly a consensus among experts as to what constitutes a pattern, an ascending triangle or a head and shoulders, for example, patterns occur over different time intervals and evolve, passing through different “states”, such as an “emerging” pattern or “completed” pattern. In fact, a pattern can begin as one type, evolve and morph into another type; a wedge pattern may turn in to a symmetrical triangle. Emerging patterns either materialize as a completed pattern, and a possible trade opportunity, or merely dissolve into random price action.

The alchemy of pattern recognition

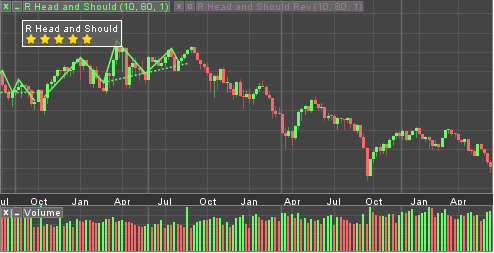
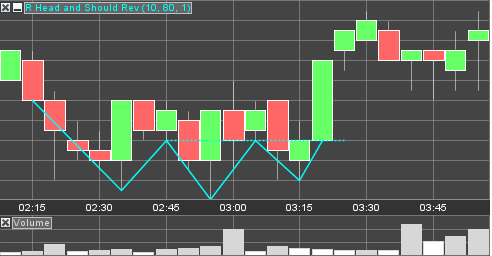
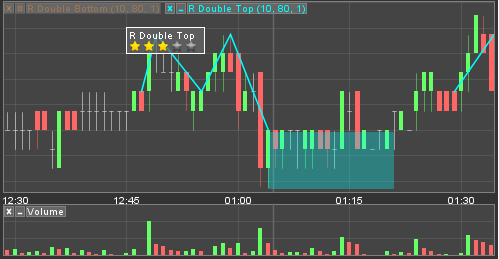
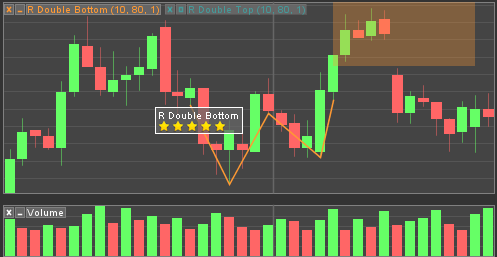
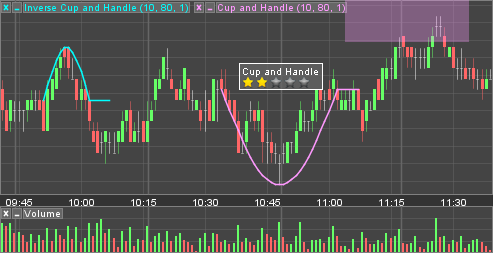
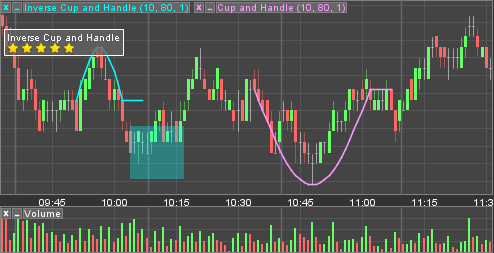
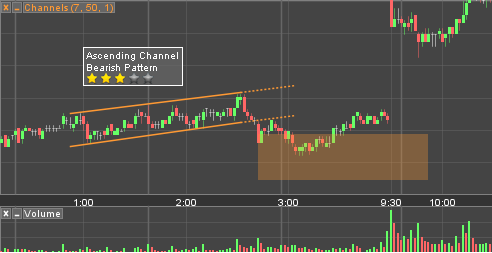
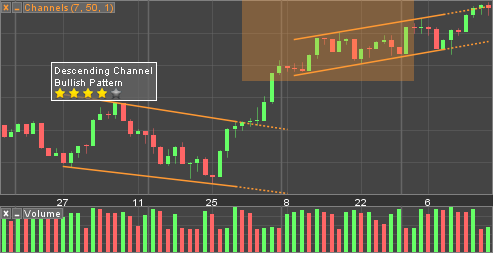
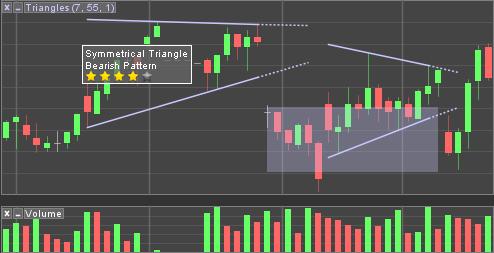
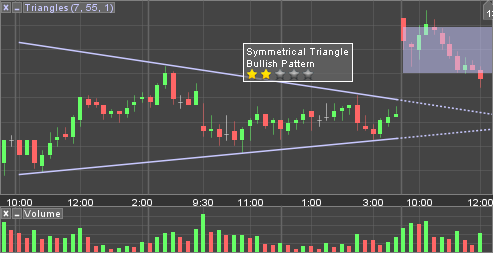
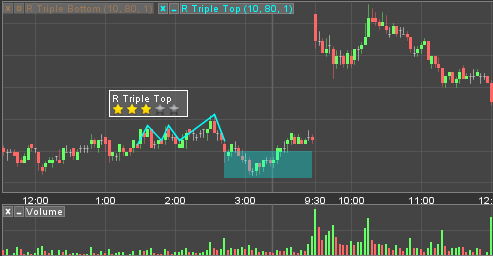
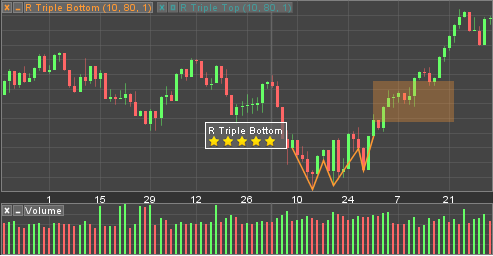
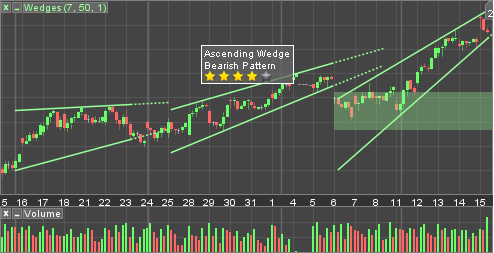
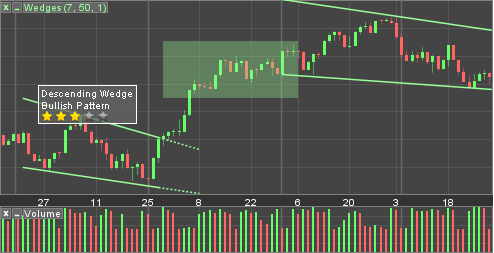
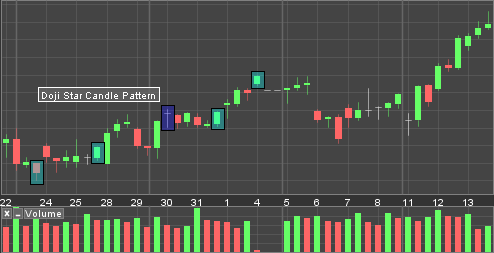
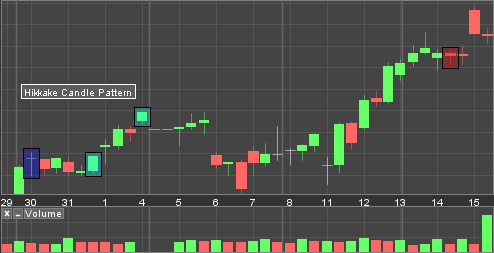
ProChart Pattern Recognition (PPR) uses proprietary algorithms and statistical methods to automate the process an expert would use to identify patterns. PPR currently identifies all popular pattern types, including head and shoulders (top and bottom), double and triple tops and bottoms, wedges, channels, triangles (symmetrical, ascending, descending), and more.

Beyond pattern recognition, PPR uses a variety of criteria, such as price action context (incoming trend), number of touch points, strength of breakout, technical indicators, and other variables to assess a pattern’s strength. Each pattern is evaluated and a relative strength ranking assigned. Although a 5 star system is used in the examples displayed here, there are a variety of options available for evaluating and ranking patterns.

Targets, testing and trading

As patterns are completed the PPR software also computes a price target displayed as a shaded rectangular region. Price targets project a range in terms of price (vertical direction) and time (horizontal direction).

Patterns can be scanned and displayed in real-time, giving users the inside track on possible trading opportunities. In addition to real-time scans, patterns can be scanned over historical data, using virtually any time frame and bar interval. Historical patterns come complete with the same information as real-time patterns; pattern description, strength ranking and price target. Historical patterns provide performance information in the context of an instrument’s bigger (price action) picture. Knowing how a pattern has performed historically is significant, it gives users more information. More information means users are better equipped to make trading decisions when the next opportunity presents itself.

The heavy lifting – servers, clients and the rest

ProChart’s Pattern Recognition software runs on a server where real-time scans are performed and delivered to users (subscribers) through any number of delivery mechanisms; reports, alerts, email, mobile etc. The management of pattern selection, scan interval, instrument selection, delivery and ultimately trade options can be handled through a separate UI, designed to meet your needs, and/or integrated seamlessly into your existing platform.

Pattern scans (historical and real-time) are seamlessly supported by VE’s charting product, ProChart, however, integration with other charting products is possible.

Patterns

Request a Demo